Monday, June 10, 2013

PHYSICS 4C Final Project

Purpose: to analyze aliasing and fluid dynamics in sinusoidal water waves shot with high speed video

Equipment:
  • 8 meters of acrylic tubing
  • Water facet(2)
  • Frequency generator(2)
  • Speakers(2)
  • Alligator clips(2)
  • Large empty bucket
  • Paper towels
  • High speed camera
  • Duck tape
  • loggerPro software
Experiment:

The first part of our experiment included a general set up of how we would transfer the frequency from a generator to a stream of flowing water. Michelle Tostado (my project partner) and I agreed that we would get the most repeatable data for future 4C students using two of the Physics4C frequency generator to produce both our waves.

The general set up of our project was drawn and outlined bellow


The first step was to find the correct thickness for our tubing. We had initially attempted our experiment using a garden hose, and that resulted in no appreciable data due to the rigidity of the rubber and surrounding mesh. Therefore, we found that using simple thin aquarium tubing from WalMart Superstore was best, as illustrated bellow. 


Our next step was to find a way to properly secure the acrylic tubing, with the flowing facet water, to a speaker. In the case of one single generated sinusoidal wave being produced, it used a single speaker, that had the tubing taped onto it, as displayed bellow.


Some of the issues we had with the first set up was using too much tape, or using too little. The issue was overcome by trial and error, and an observation for expected steady stream of water.


Once we had achieved a correct water pressure to laminar flow of water, we knew our assumptions for fluid dynamics could be simplified and disregard turbulence or rotational velocity in our initial conditions. Therefore, based on Bernoulli's Equation


Our initial fluid velocity was related to the area of the open ended acrylic tubing. Moreover, this allowed for a direct relationship of the water pressure from the facet, eithre increasing or decreasing with the turning of its key, to the velocity of the flowing water bellow. 

The first attempt at making a sinosoidal wave utilized the frequency generator at 24Hz with 10 Volts as shown bellow.


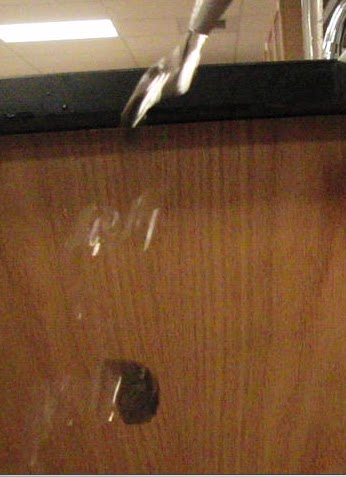
The water did not do anything appreciable to the naked eye, and the video bellow is a representation of how it was perceived in person using the human eye as a tool of visual analysis. 


The real trick to this problem was using the correct frames per second in the recording instrumentation for this lab. Once the stream of water was recorded at 240 frames/sec, the following behavior was reveled as shown bellow.


It is important to note that the reason the video has a perceived motion is due to the effect known as aliasing. Aliasing is the static distortion in digital video caused by a low sampling rate. This phenomenon must be familiar to you if you have ever brought a camera near a computer monitor and observed jagged patterns.

The manner aliasing is manefested in our experiement  is as follows. In the harmonic frequency, the frames per second and the frequency generator are in synch. The result is an apperance of stilness at the 30Hz frequency.

At a lower frequency of 28Hz, the water appears to be moving up. The manifestion of aliasing in this video is at a slower rate, so the frequency is simply falling behind.


An example of a leading frames per second occurs at 32Hz, giving the water flow an apperance of a downward motion.


In figuring out how to computationally analyze the videos and still frame-shots of this experiment using loggerPro,  we found another significant fluid dynamics variable. The water poured down of the open end of the acrylic tubing with a velocity vector pointing downward, but it also had another velocity vector pointing at an angle, producing a parabolic projection downward as illustrated bellow due to gravitational force.
Velocity Vectors of water faling (2D Aspect)


With this of rotational parabolic motion in mind, we knew we would have to configure our data two dimensionally to be able to analyze our project.


In addition to the analysis of a single wave phenomenon, our objective was also to analyze the interaction of TWO water waves in a constructive and destructive intereference pattern.

The constructive wave pattern set two hoses in two different facets(as shown bellow), each attached to an individual speaker, running from the same frequency generator to reduce differences in frequency.


The two acrylic tubing were held in the same plan parallel to one another by one of the students to insure an ideal trajectory and point of contact. Bellow is an illustration of the two speakers side to side ready to be tested.


In addition to coupled data collection, we also dealt with a cleaning problem. The experiment created a large wet mess, that was largely contained by two buckets, but some spill over still managed to sufficiently dampen the tile floor.
Wet and messy floor

Our cleaning procedure was then set to use paper towels, to avoid having a lab safety hazard and a possibility of slipping on the surface, as soon as we had collected a visual recording of the experiment.

Lab safety and cleaning protocal

Data Analysis:

Our data analysis involved using the software loggerPro. Both video and still shots of  the experiment were utilized to analyze the sinosoidal behaviour of our fluid waves.

Bellow is the still shot of  the frequency of 28Hz


The methology used was plotting various data points, following the stream of water, manually into the uploaded picture. The multitude of red dots were then put against an axis and fit against a sine wave. 


A linear regression line was also used to find an arbitary value of the planer speed of the stream of water, which resulted in a value of 3.328 +/- 0.001


Following, the 30Hz fundamental frequency was also analyzed using logger pro from the following still shot.


Again, various points were plotted with a shifting axis that resulted in a fitted sinosoidal wave. This wave  for the 30Hz had an appreciatable outlining fit of RMSE: 5.657.


Lastly, the 32Hz frequency generated a stillshot to be analyzed using logger pro


Without surprise, the computational analysis of this wave resulted in a fitted sinosoidal wave, just with a smaller RMSE of 3.736


Conclusion:

Based on the sinosoidal function fitting of the fluid stream of water, we have determined that they are in fact sinosoidal waves. This analysis was been possible due to the simplification of the parameters, assuming laminar flow and ignoring the various angled velocity vectors that parabolically extend the wave as it falls, ignorning gravitational acceleration at the bottom tier of the wave, and selecting the characteristic first few waves for analysis.

In addition, we also figured out that our parameters were well define to analyze a 2 dimensional wave from its profile. Yet, the constructive and destructive waves interacted in all planes and provided puzzling data, which at this time, we are unable to grasp and analyze since it would require various perspective simulatenous analysis from at least three video sources to compare and contrast each perceived interaction with one another.

As a whole, the objectives for this project were met. We were able to 1) analyze aliasing 2) developing sinosoidal wave using the frequency generator  and 3) utilize computational modeling of sinosoidal waves from data for an uncertainty value.

Wednesday, May 15, 2013

Experiment 15: Color and Spectra

Purpose: To view the spectrum of colors found in white light and a hydrogen plasma tube in order to measure the wavelength of several different colors.
Equipment:
  • Two meter sticks
  • Metal clamps
  • Flourescent lamp
  • Hydrogen tube
  • Diffraction grating
Experiment:

A diffraction grating was held infront of one of the student's eyes.

The student was then positioned ~1 meter stick away from the light source(flourescent lamp).

A rainbow appeared to the left of the viewer.


The distance of each color was then measured and recorded.
In addition to the spectrum of white light, a hydrogen plama light source was used.
This member created narrow distinct lines, as they appear in the picture bellow..


 The distances of the different wavelengths were then measured for this light source.

Data Analysis:
Using the geometric relationship of the wavelenght distance on the set right angle with the two meter sticks, the wavelengths were solved for


Conclusion:

The three different bands of light corresponding to violet, teal and red have acceptable values within their uncertainty.


All the calculated values for different wavelengths agreed within a 1% error of the theoretical values. 

Experiment 14: Potential Energy Diagrams & Potential Wells

Purpose: to use a computational model to analyze a potential energy diagram and well.

Part A) Potential Energy Diagrams

A particle of energy 12 x 10-7 J moves in a region of space in which the potential energy is 10 x 10-7 J between the points -5 cm and 0 cm, zero between the points 0 cm and +5 cm, and 20 x 10-7 J everywhere else.


Question 1: Range of Motion
What will be the range of motion of the particle when subject to this potential energy function?
·         Range of motion is between -5 and 5 cm 

Question 2: Turning Points
Clearly state why the particle cannot travel more than 5 cm from the origin.
  • the particle doesn’t have enough energy to surpass the potential barrier.
Question 3: Probability of Detection
Assume we measure the position of the particle at several random times. Is there a higher probability of detecting the particle between -5 cm and 0 cm or between 0 cm and +5 cm?
·         Probability of detection is higher between -5 and 0 because the particle spends more time there (less kinetic energy).

Question 4: Range of Motion
What will happen to the range of motion of the particle if its energy is doubled?
·         E=1/2kx^x, 2E>sqrt2x

Question 5: Kinetic Energy
Clearly describe the shape of the graph of the particle's kinetic energy vs. position.
  • Kinetic energy vs potential is an upside down parabola with vertex at x=0
Question 6: Most Likely Location(s)
Assume we measure the position of the particle at several random times. Where will the particle most likely be detected?
  • Most detected at extrema since kinetic energy is minimum


Part B) Potential Wells
A particle is trapped in a one-dimensional region of space by a potential energy function which is zero between positions zero and L, and equal to U0 at all other positions. This is referred to as a potential well of depth U0.
Examine a proton in a potential well of depth 50 MeV and width 10 x 10-15 m.


Question 1: Infinite Well
If the potential well was infinitely deep, determine the ground state energy. Is this also the ground state energy in the finite well?
·         The ground state energy in an infinite well in greater than a finite well

Question 2: First Excited State
If the potential well was infinitely deep, determine the energy of the first excited state (n = 2). Is this also the energy of the first excited state in the finite well?
·         Energy of infinite=8.4 MeV. Not allowed in finite well.

Question 3: "Forbidden" Regions
Since the wavefunction can penetrate into the "forbidden" regions, will the energy of the first excited state in the finite well to be greater than or less than the energy of the first excited state in the infinite well? Why?
·         Energy infinite>energy finite; wavelength infinite<energy finite

Question 4: More Shallow Well
Will the energy of the n = 3 state increase or decrease if the depth of the potential well is decreased from 50 MeV to 25 MeV? Why?
·         If U decreases, then wavelength decreases

Question 5: Penetration Depth
What will happen to the penetration depth as the mass of the particle is increased?
·         If m increases, then penetration length decreases

Thursday, May 9, 2013

Experiment 13: Relativity of Time and Distance


Purpose: to use computational models at near light speed scenarios to analyze relativity and time.

Part A) Relativity of Time
Question 1: Distance traveled by the light pulse
How does the distance traveled by the light pulse on the moving light clock compare to the distance traveled by the light pulse on the stationary light clock?

The light in the moving car travels a longer distance than its stationary counterpart as displayed in the animation.

Question 2: Time interval required for light pulse travel, as measured on the earthGiven that the speed of the light pulse is independent of the speed of the light clock, how does the time interval for the light pulse to travel to the top mirror and back on the moving light clock compare to on the stationary light clock?

The observable light in the moving car is relatively faster by a factor of 1.41 compared to the stationary counterpart.

Question 3: Time interval required for light pulse travel, as measured on the light clockImagine yourself riding on the light clock. In your frame of reference, does the light pulse travel a larger distance when the clock is moving, and hence require a larger time interval to complete a single round trip?

No, time appears to run at the proper time.

Question 4: The effect of velocity on time dilationWill the difference in light pulse travel time between the earth's timers and the light clock's timers increase, decrease, or stay the same as the velocity of the light clock is decreased?
In decreasing the speed, the distance is decreased and the difference in time therefore decreases.

Question 5: The time dilation formulaUsing the time dilation formula, predict how long it will take for the light pulse to travel back and forth between mirrors, as measured by an earth-bound observer, when the light clock has a Lorentz factor (γ) of 1.2.
 

Question 6: The time dilation formula, one more timeIf the time interval between departure and return of the light pulse is measured to be 7.45 µs by an earth-bound observer, what is the Lorentz factor of the light clock as it moves relative to the earth?


Part B) Relativity of Length

Question 1: Round-trip time interval, as measured on the light clock_Imagine riding on the left end of the light clock. A pulse of light departs the left end, travels to the right end, reflects, and returns to the left end of the light clock. Does your measurement of this round-trip time interval depend on whether the light clock is moving or stationary relative to the earth?

Time does not depend on whether the light clock is moving or stationary relative to the earth.

Question 2: Round-trip time interval, as measured on the earth
Will the round-trip time interval for the light pulse as measured on the earth be longer, shorter, or the same as the time interval measured on the light clock?

The time interval will be longer as viewed on earth on the moving frame because there was a relative longer distance traveled by the light.


Question 3: Why does the moving light clock shrink?You have probably noticed that the length of the moving light clock is smaller than the length of the stationary light clock. Could the round-trip time interval as measured on the earth be equal to the product of the Lorentz factor and the proper time interval if the moving light clock were the same size as the stationary light clock?

No it is not equal because the length has decreased and the time has increased on earth(observer).

Question 4: The length contraction formulaA light clock is 1000 m long when measured at rest. How long would earth-bound observer's measure the clock to be if it had a Lorentz factor of 1.3 relative to the earth?

Experiment 12: Optical Filters

Purpose: explore the effects of polorizing filters angled in respect to one another on light intensity transmitted.

Equipment:
  • Polarizing filters
  • Meter Stick
  • Clamps
  • Lamp
  • Angle measured paper
Experiment:

Two Polarizing filter setup with light source shining through and lumens detector at end.


The angles were drawn in using an angle drawn circular paper


In the three polarizing filter experiment, we notice that with the first and last filters at 90 degrees with respect to one another, the middle filter must be at 45 degrees to maximize transmission of light.

Conclusion: 

Does the light from the fluorescent bulb have any polarization to it? If so, in what plane is the light polarized? How can you tell?
  • No, the fluorescent bulb was not polarized as it did not have any shading on it. In addition, you can tell there was a single polarization filer cannot absorbe a significant amount of light, therefore two will be needed in order to filter enought of the transmitted light.

Does the reflected light have an polarization to it? If so, in what plane is the light polarized? How can you tell?

  • Yes, the reflected light has polarization once the filters were set paralled to one another, turning pitch dark.
In addition, the only way to calculate uncertainty in this lab was the visualization of the cosine squared fuction on the logger pro.


The data plots were pretty sinosoidal and they appeared to support the conclusions in the questions asked.

Wednesday, April 10, 2013

Experiment 11: CD Diffraction

Purpose: to figure out the distance beween the grooves on a CD using diffraction methods.

Equipment:
  • Laser
  • CD
  • Meter stick(2)
  • Clamps
  • White board
Experiment:

The laser was arranged to shine a beam through the hole in a screen and strike the compact disk, a distance of ~0.5 meters.


The beam was perpendicularly striking the disk at a place where the grooves were tangentially vertical with the first order maxima.


Once the diffraction pattern appeared, the distance between the maxima was measured using the a smaller ruler at a known fixed distance fromt he CD.


Conclusion:


Based on the calculations made in this experiment, the distance of the grooves are 1535nm apart, which is a close answer to 1600nm with a 4.06% error